Module 2 - Data Connectors
Prerequisites
This module assumes that you have completed Module 1, as you will need a Microsoft Sentinel workspace provisioned.
Some of the data connectors that will be used in this lab require specific permissions on the workspace or your Azure subscription. If you don't have the appropriate permissions, you can still continue doing the rest of the labs.
Exercise 1: Enable the Azure Activity connector
This exercise shows you how to enable the Azure Activity data connector. This connector imports logs from Azure management plane activities, which lets you track Azure administrative activity within the subscription.
NOTE: Your user account must have at least Reader permissions to any subscription you want to monitor, in order to perform this exercise.
Open your Microsoft Sentinel instance by typing Sentinel into the search box, clicking the Sentinel service, and then your workspace.
Open Content Hub and search for the Azure Activity content solution.
Tick the Azure Activity solution and click either Install button.

When the deployment completes, select Data Connectors in the Configuration section of your Sentinel workspace.
In the data connectors screen, click the Azure Activity connector. If you already have lots of connectors, you can type activity into the search bar to narrow down the list. Note if the connector has only just been installed, you might need to press the Refresh button to see it.
Select the Azure Activity connector and click on Open connector page in the right-hand panel.

On the Azure Activity connector page, scroll down through the Configuration instructions until you get to number 2, Connect your subscriptions through diagnostic settings new pipeline. This method leverages Azure Policy and it brings many improvements compared to the older direct settings method (details about these improvements can be found here).
Click on Launch Azure Policy Assignment wizard, which will redirect you to the policy creation page.

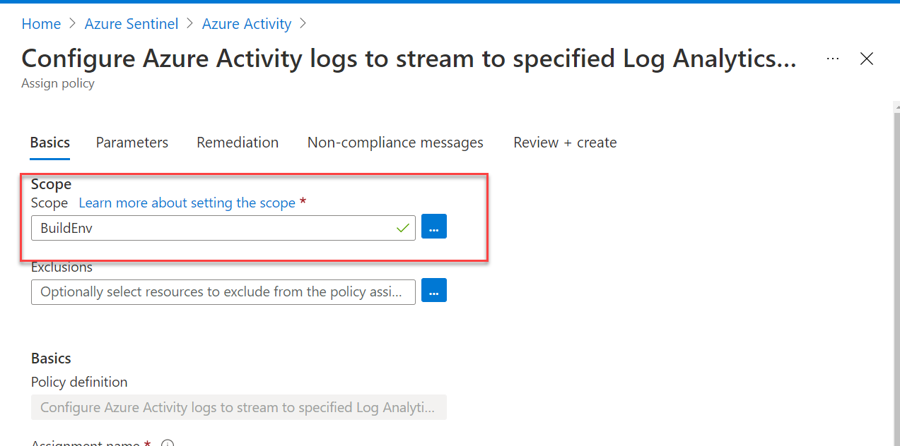
In Scope, select your subscription.
Note: Policy lets you deploy a setting to multiple possible targets - for example, if you have Owner permission at a Management Group level, you can assign a policy to configure collection of Azure Activity logs from all subscriptions under that group.
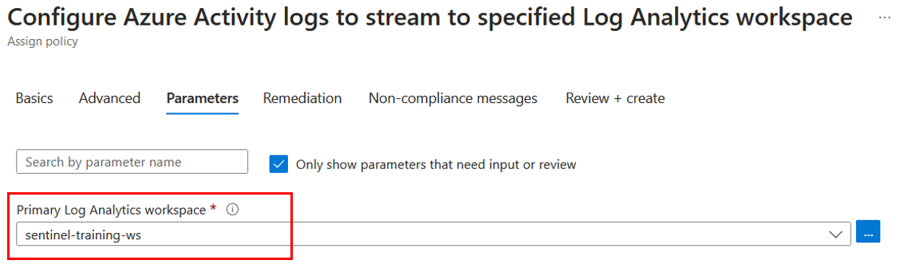
Go to the Parameters tab. On the Primary Log Analytics workspace select the Microsoft Sentinel workspace:
We'll use the deployIfNotExists (DINE) feature of Azure Policy to deploy the setting directly to any Activity logs in scope. To do this, tick Create a remediation task. Leave the Managed Identity set to a System Managed Identity, and pick a region proximate to your subscription.
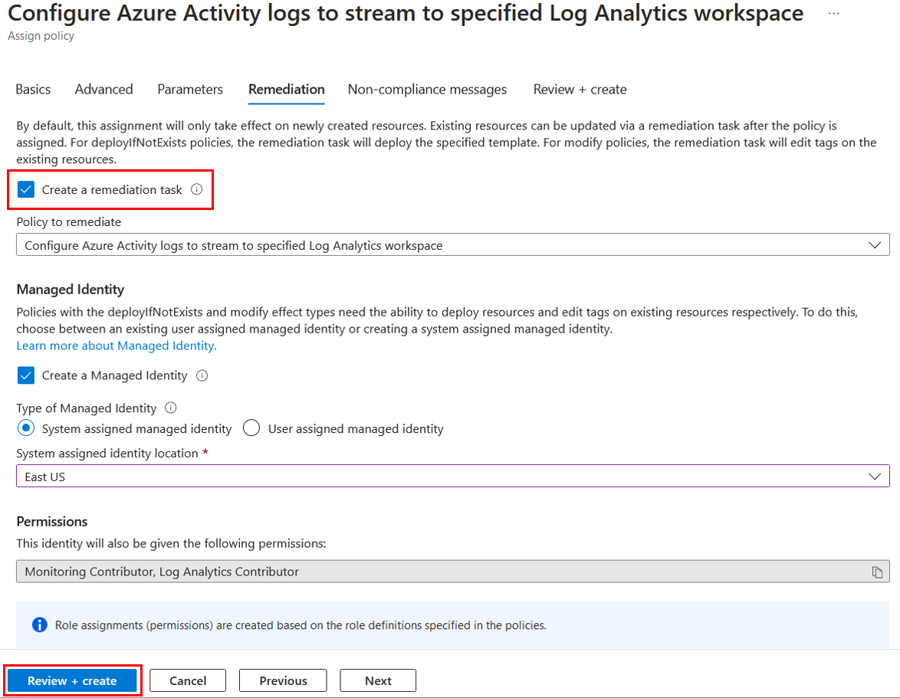
Press Review and Create, and then Create to save the policy.
It is normal if you don't immediately see the connector showing as connected and with a green bar, as Azure Policy can take some time to apply.
Note: each Subscription has a maximum of 5 destinations for its Azure Activity logs. If this limit is already reached, the policy created as part of this exercise won't be able to add an additional destination to your Microsoft Sentinel workspace. If this is the case, you can use the Diagnostic Settings for the Activity Log to remove older settings directly. You can also use Diagnostic Settings to directly connect Activity logs to Sentinel.
Head back to the Content Hub and click on the Azure Activity solution, and click the Manage button at the bottom of the panel on the right.
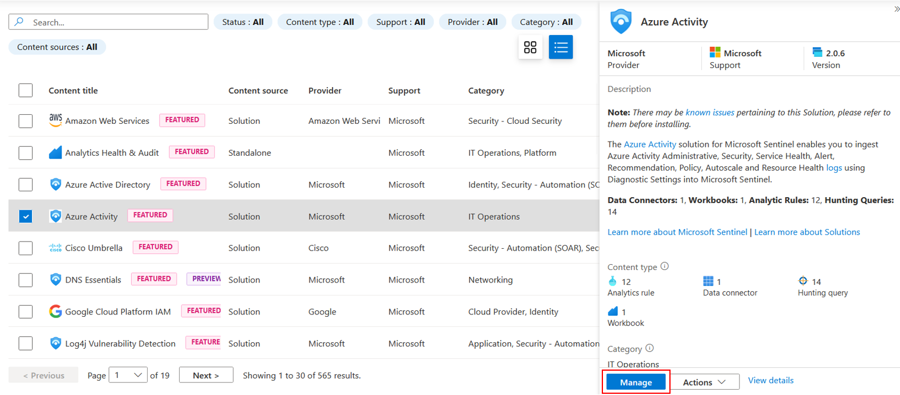
From the Manage view, the contents of the solution are displayed: any connectors, analytics rules, workbooks, hunting queries and other content included in the solution pack are visible here. Now these have been installed, they will each appear in the relevant section of the Sentinel interface (e.g. Analytics rule templates, Workbook templates and so on).


Now we've connected Activity, we'll move on to some other connectors.
This exercise shows you how to enable the Microsoft Defender for Cloud data connector. This connector allows you to stream security alerts from Microsoft Defender for Cloud into Microsoft Sentinel, so you can incorporate Alerts from Defender, view Defender data in workbooks, and investigate and respond to incidents.
NOTE: To do this exercise, your user must have the Security Reader role in the subscription. If not done already, you will also need to enable any of the Defender plans in Microsoft Defender for Cloud.
Open your Microsoft Sentinel workspace and click on the Content Hub.
Search for defender in the search bar, select the Microsoft Defender for Cloud content solution, and click Install.

After deployment finishes, click the Manage button at the bottom right. (Note you can also browse to the newly-installed connector via the Connectors blade as we did in the last exercise - we're going to do it another way this time.)
In the list of content, tick the Microsoft Defender for Cloud connector and click Open Connector Page

In the Microsoft Defender for Cloud connector page, check that your permissions are sufficient as noted in the panel at the top. If you don't have the required permissions, you can continue to the next exercise.

From the list of subscriptions at the bottom of the page, select the desired subscription and click on Connect. Wait for the operation to complete. You may wish to enable bi-directional sync for the connector, which means that alerts/incidents closed in either product will be reflected in the other.
You've now connected alerts from Microsoft Defender for Cloud. This connector populates the SecurityAlerts table when a Defender for Cloud alert is raised, but at this stage, that alert won't be promoted into an Incident. We'll cover a rule to promote the alerts in the next module.
In this exercise, we'll add the Microsoft Defender Threat Intelligence (MDTI) connector to your Sentinel workspace, which ingests Microsoft Threat Intelligence indicators automatically into the ThreatIntelligenceIndicator table. MDTI provides a set of indicators and access to the https://ti.defender.microsoft.com portal at no additional cost, with the premium features of the MDTI portal and API requiring licensing.
The Threat Intelligence content solution includes the data connectors for all supported forms of Threat Intelligence.
NOTE: Sentinel also supports importing Threat Intelligence indicators via the TAXII protocol using the Threat Intelligence - TAXII data connector, so if you have your own preferred TI source, you can add that to your workspace instead.
Open your Microsoft Sentinel workspace and click on the Content Hub.
Search for threat intel in the search bar, select the Threat Intelligence content solution, and click Install.

After deployment finishes, click the Manage button at the bottom right.

Select the Microsoft Defender Threat Intelligence (preview) connector and click Open Connector Page at the bottom right.

On the Connector page, from the Import indicators list, select an option for which indicators to import, or leave the default "All available" selected, and click Connect.

Threat Intelligence indicators will start being ingested into your ThreatIntelligenceIndicator table.
Congratulations, you have completed Module 2!. Continue to Module 3 - Analytics Rules
Last updated